

![]()
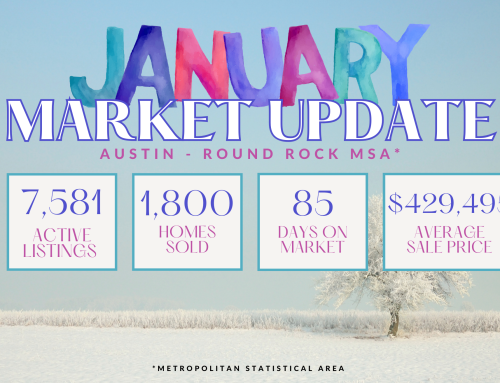
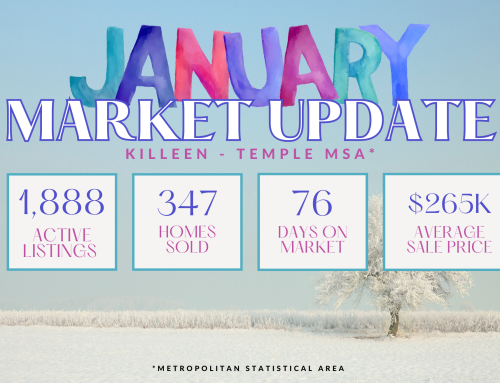
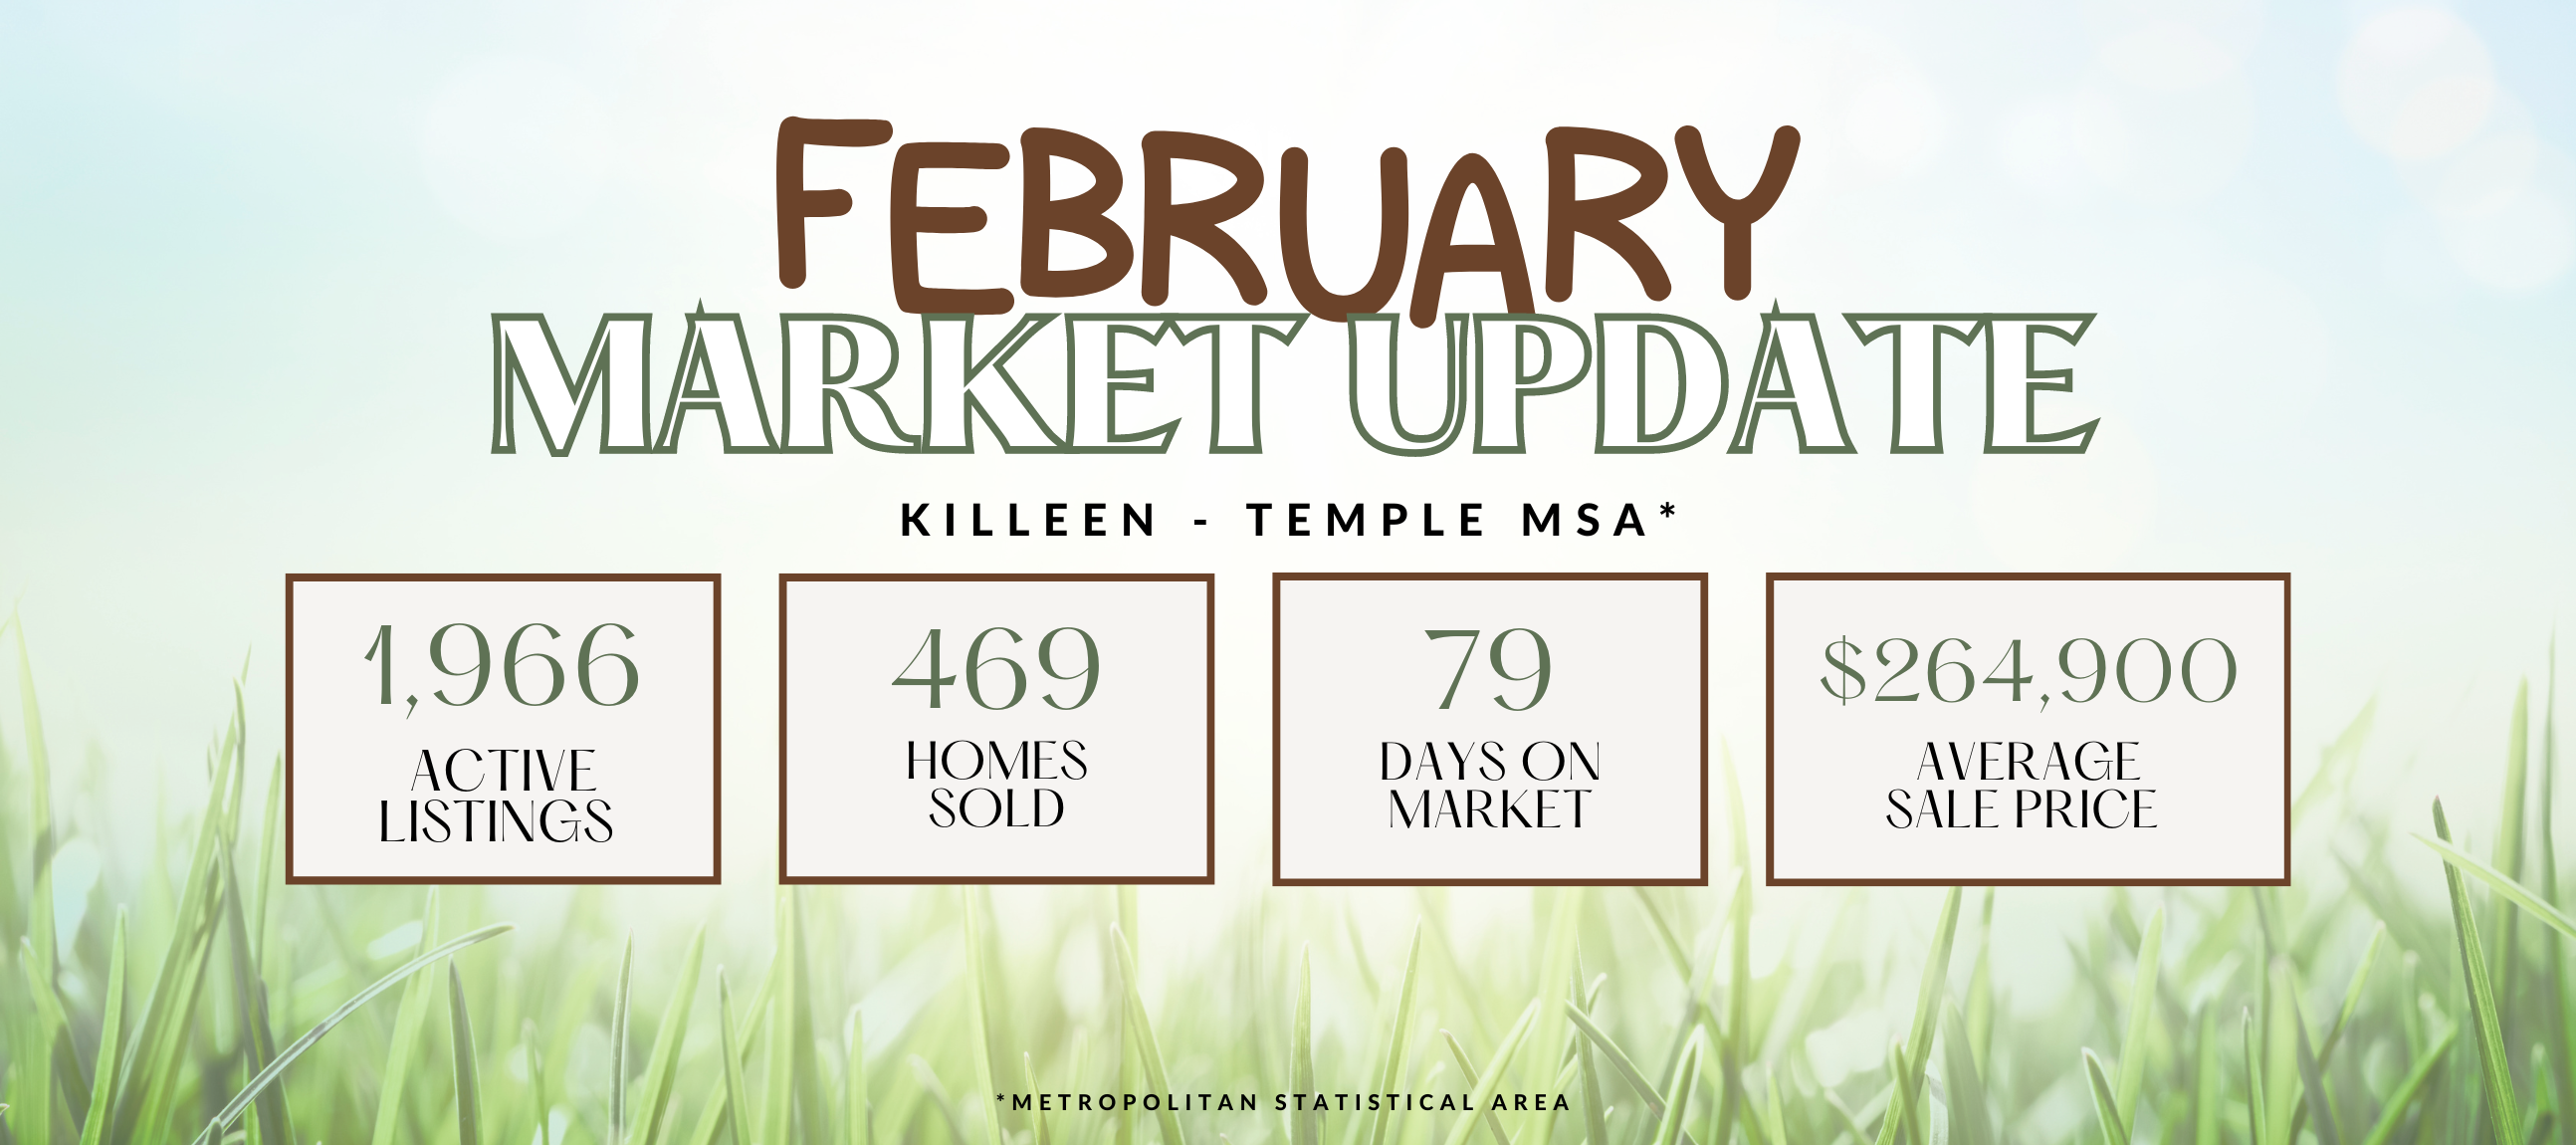
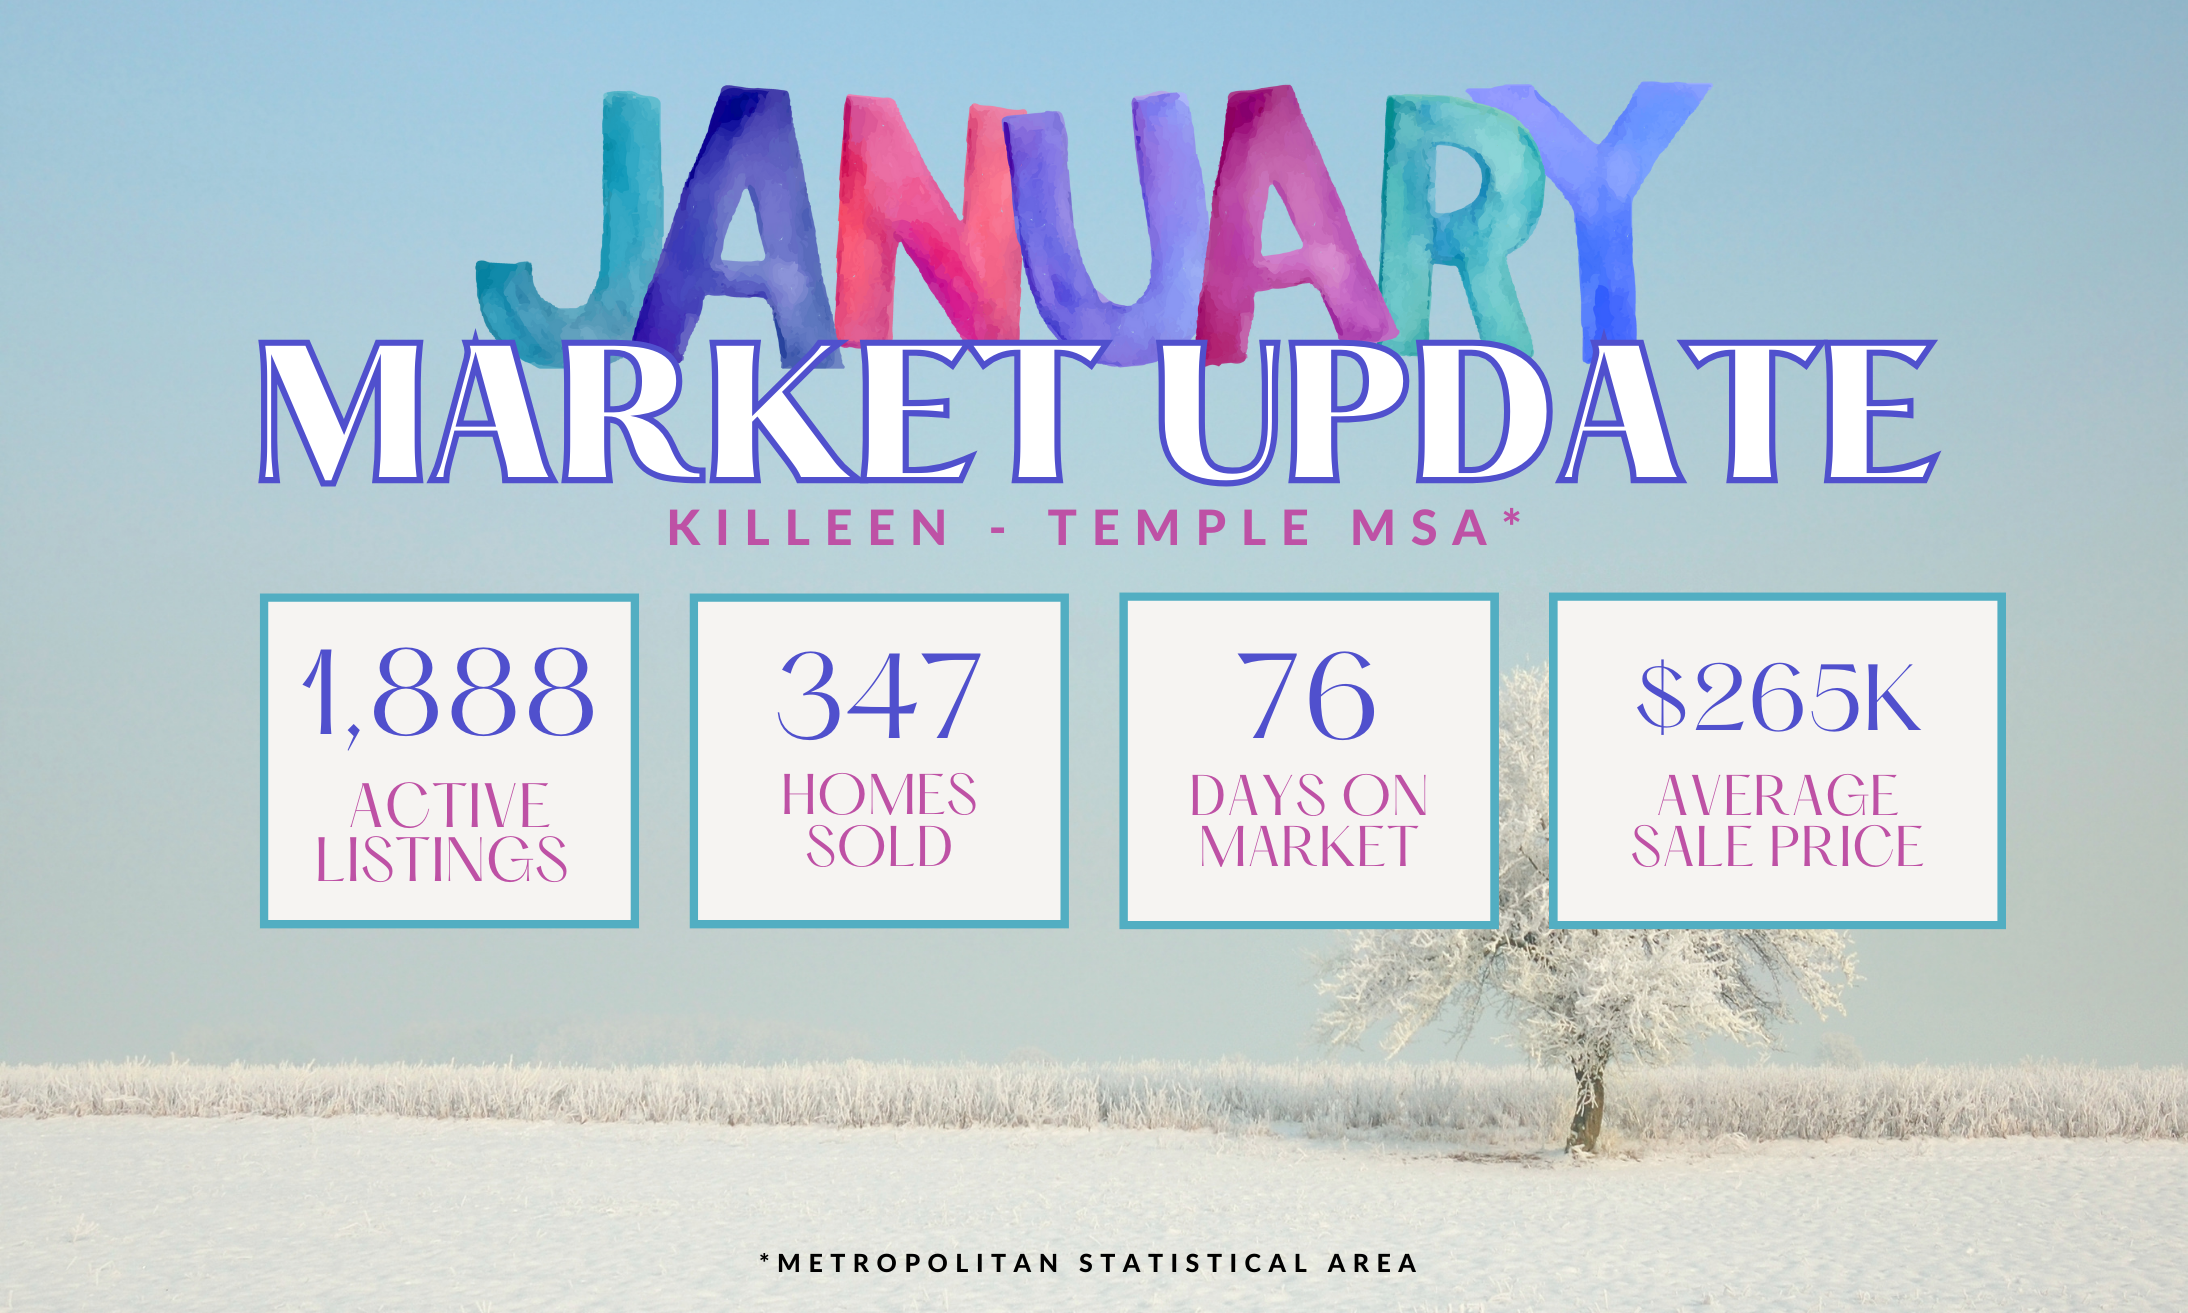
*Please keep in mind this is the Metropolitan Statistical Area (MSA) for the Austin-Round Rock area. If you want specific stats relative to your zip code, please reach out so I can get them to you!*
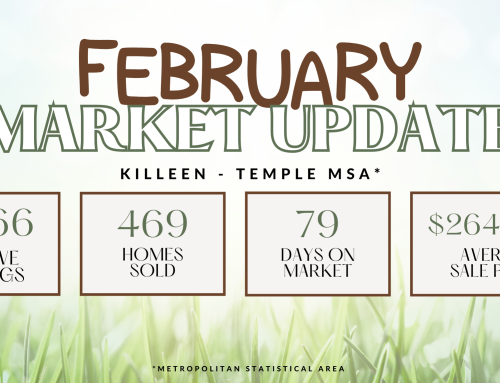
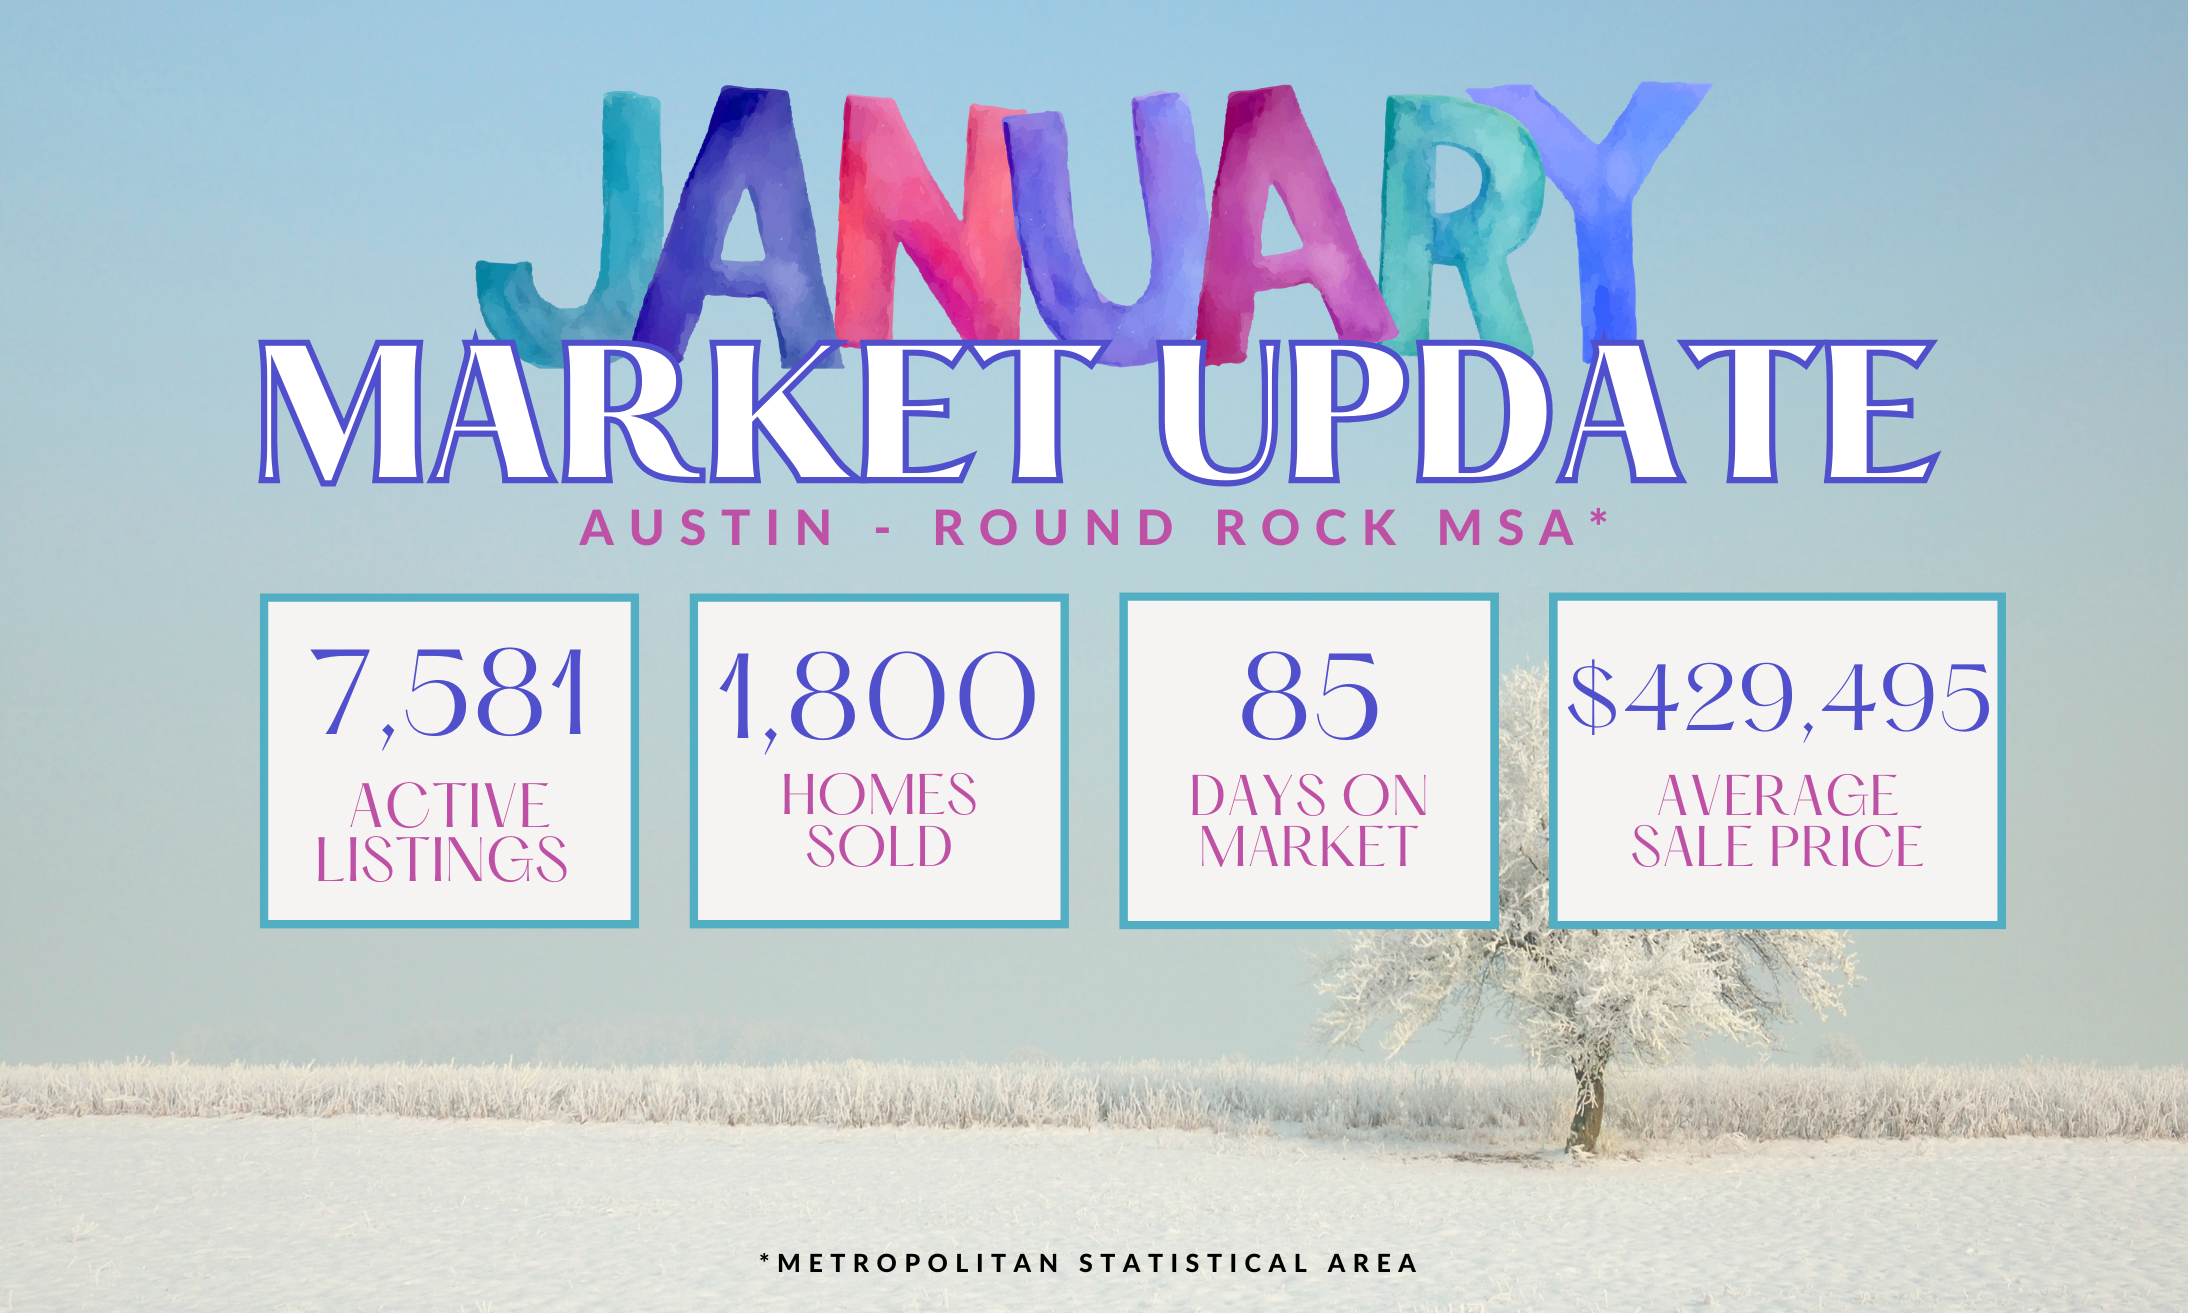
Hey there, buyers and sellers! Let’s talk about some key real estate metrics that can give you a better understanding of the current market conditions.
First off, we have the Months Supply of Inventory, which is sitting at a healthy 3.2 months. This means that if no new homes were to come on the market, it would take about 3.2 months to sell all the existing inventory. As you can see, we have seen an increase in active listings over the past year by 14.8%. While we still have a fairly low inventory, we are getting more homes listed on the market as compared to this time last year.
The Median Days Homes are On the Market is 83 days, which tells us that homes are going under contract in less than 3 months in this market.
The Median Sold Price is $440,000. This gives you an idea of the average price that homes are selling for in our metropolitan statistical area. Similarly, we have seen a home sales increase by 8.4% since February of last year. This means buyer are still buying!
Overall, these metrics paint a picture of a market with low inventory and high demand. Buyers may need to act quickly and make strong offers, while sellers may find themselves in a favorable position with homes selling due to lower inventory. Keep these metrics in mind as you navigate the real estate market and let me know if you want zip code specific stats as they differ drastically by area!

Leave A Comment